Posts in category English
The Potential of Demand Responsive Transport as a Complement to Public Transport
Demand Responsive Transport (DRT) offers a collective flexible travel alternative that can potentially complement Fixed Transit (FT). The combination of an on-demand and line-based services holds the promise of improved mobility and increased service coverage. However, insofar it remains unknown whether DRT services deliver such much anticipated improvements.
This study presents an assessment framework to evaluate the performance of DRT and related changes in accessibility and performs an empirical analysis for a recently introduced DRT service in the Netherlands. The framework includes a performance benchmark between DRT and FT based on the computation of generalized journey times of the DRT rides and the FT alternatives, and it can help identify whether DRT is used as complement or substitute of FT.
The framework covers the spatial and temporal dimensions, and the explicit consideration of rejected trips is an integral part of the evaluation. Results suggest large accessibility improvements for DRT users, especially for some underserved origin-destination pairs.
Read more of this work of Maria J. Alonso Gonzalez: TRB Paper and TRB Presentation
Opportunities for the Combined Bicycle and Transit Mode
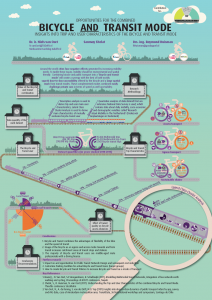
Around the world cities face negative effects generated by increasing mobility needs. To tackle these issues, mobility should be environmental and spatial friendly. Combining bicycle and public transport into a ‘bicycle + transit mode’ will create a synergy with the best of both worlds: superb door-to-door accessibility offered by the bicycle and a large spatial reach from transit modes. These complemented modes combined easily challenge private carsin terms of speed as well accessibility.
Research regarding the users and trip types of the bicycle and transit mode is largely missing. This is unfortunate, since understanding both user and trip characteristics is of the utmost importance to improve the share of the bicycle and transit mode. Policy-makers can make concrete decisions on infrastructure and service investments only when the gap between the aforementioned societal need and scientific knowledge is filled.
The main analysis in the study is based on data from the Netherlands. The Netherlands is one of the countries with a head start regarding the use of the bicycle + transit mode. A one-day trip diary survey, representative of the population of the Netherlands, with more than 250,000 respondents who made nearly 700,000 trips over the course of 6 years (2010-2015), is used to derive important trip and user characteristics of the bicycle + transit mode. Finally, latent class cluster analysis is applied to find prototypical users of this mode on the basis of their socio-demographic attributes.
It is, for example, found that the most important purposes of the bicycle and transit mode are work or education, typically involving relatively long distances. Bicycle and transit-potential for other transit network levels, such as metros and bus rapid transit can be found. Moreover, seven unique user groups – from middle-aged professionals to school children – are identified, and their different travel behaviour is discussed.
The wider benefits of high quality of public transport for cities
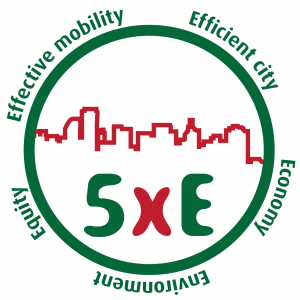
The full value of public transport is often underestimated. The 5E framework, consisting of effective mobility, efficient city, economy, environment and equity supports assessing and quantifying this value. This paper presents the framework and a wide selection of sources illustrating the wider benefits of high quality of public transport for cities.
Find our ETC conference paper HERE

Vacancy: PhD: Public Transport Data Analysis & Modelling
We are looking for a new PhD candidate in our PT research team. Click on the vacancy below or check HERE
Performance assessment of fixed and flexible public transport in a multi agent simulation framework
The emergence of innovative mobility solutions that offer flexible transport services, is changing the way urban public transport systems will be designed. Such mobility solutions offer on demand transport services and hence can solve the problems inherent with traditional line based and schedule based public transport systems. It is essential to understand the dynamics of this new demand-supply market with co-existing and competing fixed and flexible public transport. However, the performance of the system comprising of users and transit services and the factors influencing them, have received limited attention in literature. In this paper a model is developed to analyse the system performance when the modes of fixed public transport and flexible public transport operate in competition. The model is implemented in the multi-agent simulation framework MATSim with dynamic assignment in which the users optimize their travel plan through iterative learning from the service experienced and altering their travel plan. The scenarios in which the flexible public transport offer private and shared services are considered. The system performance is analysed for varying fleet size of flexible public transport and ratio of cost of flexible to fixed public transport.
Find the paper HERE
Data-driven transfer inference for public transport journeys during disruptions
Disruptions in public transport have major impact on passengers and disproportional effects on passenger satisfaction. The availability of smart card data gives opportunities to better quantify disruption impacts on passengers’ experienced journey travel time and comfort. For this, accurate journey inference from raw transaction data is required. Several rule-based algorithms exist to infer whether a passenger alighting and subsequent boarding is categorized as transfer or final destination where an activity is performed. Although this logic can infer transfers during undisrupted public transport operations, these algorithms have limitations during disruptions: disruptions and subsequent operational rescheduling measures can force passengers to travel via routes which would be non-optimal or illogical during undisrupted operations. Therefore, applying existing algorithms can lead to biased journey inference and biased disruption impact quantification. We develop and apply a new transfer inference algorithm which infers journeys from raw smart card transactions in an accurate way during both disrupted and undisrupted operations. In this algorithm we incorporate the effects of denied boarding, transferring to a vehicle of the same line (due to operator rescheduling measures as short-turning), and the use of public transport services of another operator on another network level as intermediate journey stage during disruptions. This results in an algorithm with an improved transfer inference performance compared to existing algorithms.
Find the paper HERE
Urban Demand Responsive Transport in the Mobility as a Service ecosystem: its role and potential market share
Mobility as a Service (MaaS) is entering the transportation market. MaaS aims at the full
integration of the existing transportation services and it offers tailored mobility packages to
the user. In MaaS ecosystems, on-demand services play an important role as complement to
public transport due to their flexibility. However, to date, most attention has been placed on
individual on-demand services. This study focuses on Demand Responsive Transport (DRT):
collective on-demand services. Using an on-line survey, we analysed the characteristics of
the respondents who chose different modes of transport among their selected modes.
Results find a distinctive pattern in the willingness of users to use different modes, with
different levels in what could be considered as a multimodality ladder. The different rungs of
it would be: 1st car (if available), 2nd public transport, 3rd DRT and 4th taxi-like services.
This way, a person standing on the third rung would include car, public transport and DRT in
their consideration set, but not taxi. This finding suggests that, if implemented in the right
way, DRT services can attract a larger number of users than taxi-like services, especially in a
MaaS ecosystem where initial barriers to try this service can be lessened.
Find the paper presented by Maria Alonso Gonzalez at the Thredbo conference in Stockholm HERE
The wider benefits of high quality public transport for cities
The true value of public transport is often underestimated systematically while assessing transit impacts of proposed projects. During the planning and assessment of new or improved connections, infrastructure or services, often only the costs of operations, construction and the revenues with regard to fares and travel time savings are accounted for. This approach provides insights into the performance of public transport to some extent, but disregards many other (positive) effects the provision of public services has. Many of which impose an advantage over competing modes of transport. This could result in the postponement or even cancellation of plans, as means are scarce and invested where gains are directly visible. Thus, to enable a fairer assessment of public transport plans, more insight is required into the wider benefits of its operations and impacts on passengers and the environment.
To gain these insights, we developed a methodology to quantify the value of public transport using the five E’s: Effective mobility, Efficient city, Economy, Environment and Equity. Together these aspects provide a better indication of all potential benefits of public transport.
Read more in this ETC 2017 conference paper.

Understanding the trip and user characteristics of the combined bicycle and transit mode
Several cities around the world are facing mobility related problems such as traffic congestion and air pollution. Although limited individually, the combination of bicycle and transit offers speed and accessibility; by complementing each other’s characteristics the bicycle and transit combination can compete with automobiles. Recognising this, several studies have investigated policies that encourage integration of these modes. However, empirical analysis of the actual users and trips of the combined mode is largely missing. This study addresses this gap by (i) reviewing empirical findings on related modes, (ii) deriving user and trip characteristics of the bicycle and transit mode in the Netherlands, and (iii) applying latent class cluster analysis to discover prototypical users based on their socio-demographic attributes. Most trips by this mode are found to be for relatively long commutes where transit is in the form of trains, and bicycle and walking are access and egress modes respectively. Furthermore, seven user groups are identified and their spatial and temporal travel behaviour is discussed. Transport authorities may use the empirical results in this study to further streamline integration of bicycle and transit for its largest users as well as to tailor policies to attract more travellers.
Find our Thredbo conference presentation HERE
Read our paper HERE
Modelling Multimodal Transit Networks: Integration of bus networks with walking and cycling
Demand for (public) transportation is subject to dynamics affected by technological, spatial, societal and demographic aspects. The political environment, together with financial and spatial constraints limit the possibilities to address transit issues arising from growing demand through the construction of new infrastructure. Upgrading of existing services and improving integration over the entire trip chain (including cycling) are two options that can address these transport issues. However, transport planners and transport service operators often fail to include the entire trip when improving services, as improvement is normally achieved through the adaptations of characteristics (e.g. speeds, stop distances) of the services.
Our developed framework consists of two parts: one to assess the characteristics of the different bus services and their access and egress modes, and one to assess the effects of integration of these services, which includes the modelling and analysis in a regional transit model. The framework has successfully been applied to a case study showing that bus systems with higher frequencies and speeds can attract twice the amount of cyclists on the access and egress sides. It also shows that passengers accept longer access and egress distances with more positive characteristics of the bus service (higher speeds, higher frequencies).
Find the presentation of Judith Brand at MT-ITS in Napoli HERE
Find our paper HERE


